How does AI reshape sovereign risk?
Chessboard Sovereign Risk Index (CSI) · Kelun Wang & team

AI changes more than the technology sector. It creates demand for electricity, water, minerals, and data centers, while changing the economics of knowledge work. For a sovereign investor, the question is how those forces change a country’s capacity to create and retain economic value.
In this capstone with Gramercy Funds Management and UC San Diego’s Rady School of Management, our five-person team developed the Chessboard Sovereign Risk Index (CSI): a structured way to bring those forces into cross-country investment research.
The investment question
A country can have abundant resources without the infrastructure to turn them into computing capacity. Another can attract data centers while facing constraints on power, water, or skilled labor. An economy with a large services sector may have both opportunities for AI adoption and exposure to disruption.
CSI was designed to make these differences easier to investigate through a consistent research framework. The pilot covered Brazil, India, the Philippines, Singapore, the United Arab Emirates, and the United States. The final presentation organized the research around 64 indicators across four workstreams.
The intended use was a recurring addition to sovereign research: identify the drivers of a country’s position, inspect the supporting evidence, and decide where deeper due diligence is warranted.
Four connected research dimensions
The framework brings together the supply of physical inputs, the ability to deploy compute, the exposure of cognitive work, and the institutions that shape economic outcomes.
Physical inputs
Energy, water, minerals, and food: the resources behind an expanding AI economy.
Productive capacity
Data centers, available power, and investment: the capacity to support AI activity.
Workforce exposure
Knowledge work and service-sector exposure to changes in automation and AI adoption.
Value capture
Policy and institutional conditions that help translate investment into domestic economic value.
Looking across the dimensions matters as much as looking within them. A resource advantage prompts a second question about infrastructure; an infrastructure expansion prompts questions about workforce exposure and governance. This makes the framework useful for explaining a country thesis, beyond simply reporting a composite result.
What the six-country pilot revealed
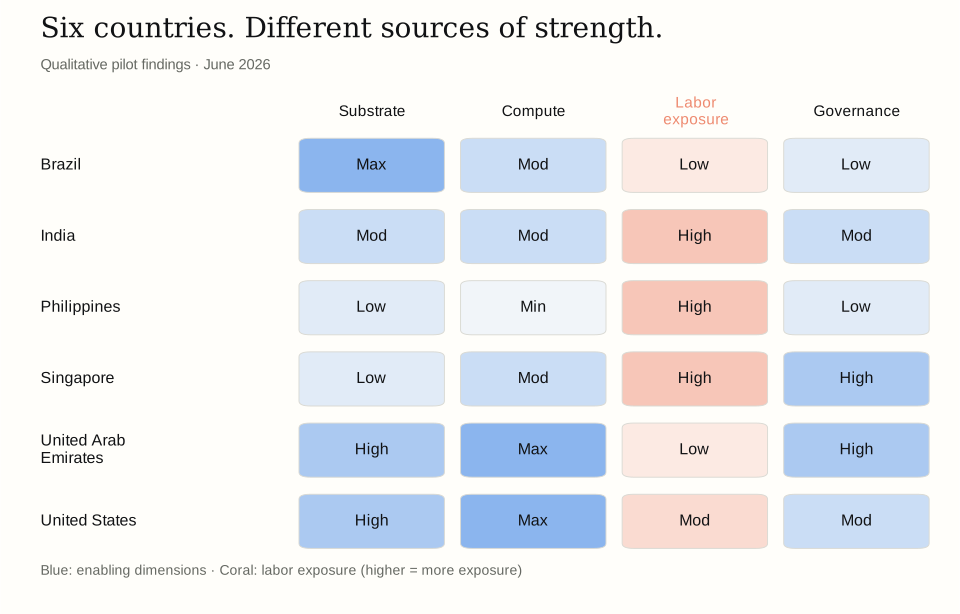
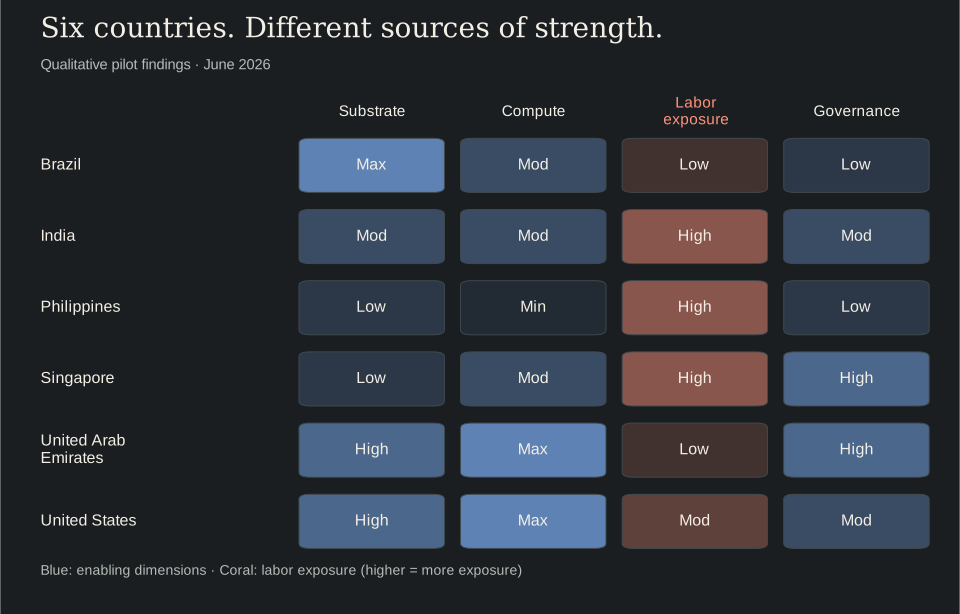
The final review showed that similar AI narratives can hide very different country profiles. The comparison below preserves the report’s qualitative categories, with countries arranged alphabetically rather than as a league table.1
View the country comparison as a table
| Country | Substrate | Compute | Labor exposure | Governance |
|---|---|---|---|---|
| Brazil | Max | Mod | Low | Low |
| India | Mod | Mod | High | Mod |
| Philippines | Low | Min | High | Low |
| Singapore | Low | Mod | High | High |
| United Arab Emirates | High | Max | Low | High |
| United States | High | Max | Mod | Mod |
Brazil and Singapore: two different constraints
In the pilot, Brazil combined the highest substrate category with moderate compute and low governance. That combination points to a conversion problem: a strong resource base alone does not establish the ability to turn AI-related demand into domestic value. The research follow-up is to examine which infrastructure and institutional constraints stand between resource supply and productive investment.
Singapore showed the reverse resource–governance pattern: low substrate, high governance, alongside moderate compute and high labor exposure. Its profile makes institutional capacity relevant even where domestic resources are limited. The comparison suggests two distinct research questions: how a resource-rich economy converts its inputs into value, and how a resource-constrained economy sustains access to inputs while adapting its workforce. These are interpretations of the pilot profiles, not causal estimates of governance effects.
Similar compute positions, different labor exposure
The United States and UAE both appeared in the high substrate and maximum compute categories. Their other dimensions differed: the report assigned the UAE lower labor exposure and higher governance than the United States. Looking only at compute would miss those differences; a useful country thesis needs to explain the surrounding conditions as well.
India and the Philippines both showed high labor exposure, but India had moderate compute and governance while the Philippines had minimum compute and low governance. The resulting research question is how exposure to changes in knowledge work interacts with the capacity to adapt. A high exposure category does not by itself measure job losses, productivity gains, or future sovereign returns.
The contribution of this comparison is the diagnosis: it identifies different questions for country research instead of treating all AI-related opportunity or risk as interchangeable.
From scattered evidence to a repeatable process
The challenge was not just finding data. Sources differed in their units, reference dates, definitions, and coverage. An announced data center and a measured operating asset could describe very different levels of readiness, even when both appeared under the same country heading.
We used Python and PostgreSQL to support a repeatable collection and preparation process. Structured sources formed the starting point; AI-assisted research helped locate evidence where coverage was incomplete or information was unstructured. Source references and confidence information made the resulting observations easier to inspect.
- 01Find evidence
Public datasets, institutional reports, and documented research.
- 02Make it comparable
Align definitions, countries, units, and observation dates.
- 03Check the basis
Inspect coverage, source quality, and sensitivity to assumptions.
- 04Support a decision
Connect country comparisons to questions for further research.
The workflow drew on public institutional sources such as the World Bank, FAOSTAT, energy agencies, and government publications. Automation reduced repeated data assembly, while provenance and review made it possible to examine the basis of an assessment.
A small code example: checking country coverage
A country comparison needs a complete set of country outputs before its differences can be interpreted. The compute workstream contains this three-line coverage check, quoted with indentation normalized:2
scored = {r[0] for r in cur.fetchall()}
missing = set(COUNTRIES) - scored
return (not missing), f"Countries not scored: {missing}" if missing else "OK"
The preceding query retrieves the countries represented in the latest completed compute run. The first line collects those identifiers; the second compares them with the expected country set; the third returns a pass/fail result and names any missing countries.
For example, if the expected set contains six countries and one has no output, the check fails instead of silently presenting a five-country comparison. It checks presence, not correctness: six populated results can still contain weak evidence or unstable assumptions. That is why coverage checks sit alongside source review and sensitivity analysis. This excerpt concerns generic validation only; it does not reveal the index’s scoring rules.
What the project delivered
The team delivered a six-country research pilot, a repeatable analytical workflow, and a model and research package, presented to Gramercy in June 2026. The final report also demonstrated how a dashboard could connect a country-level summary to its underlying research dimensions and evidence.
The business case had three parts:
- Research efficiency: reduce repeated collection and preparation so analysts can spend more time developing and testing investment theses.
- Clearer investment discussions: explain which resources, infrastructure conditions, labor exposures, and policy factors drive a country assessment.
- A basis for recurring coverage: support refreshes and a consistent starting point for comparing changes across countries.
The final presentation proposed quarterly use within the client’s research process. Its time-saving and capacity estimates were a business-case assessment; they do not establish realized savings or investment returns.
Putting the business case in numbers
The final presentation estimated roughly $96.7K per year in analyst capacity value, using 10 hours per week at an effective cost of $186 per hour.3 With a 52-week annualization, that is:
\[ 10\;\text{hours/week} \times \$186\;\text{/hour} \times 52\;\text{weeks} = \$96{,}720\;\text{/year}. \]
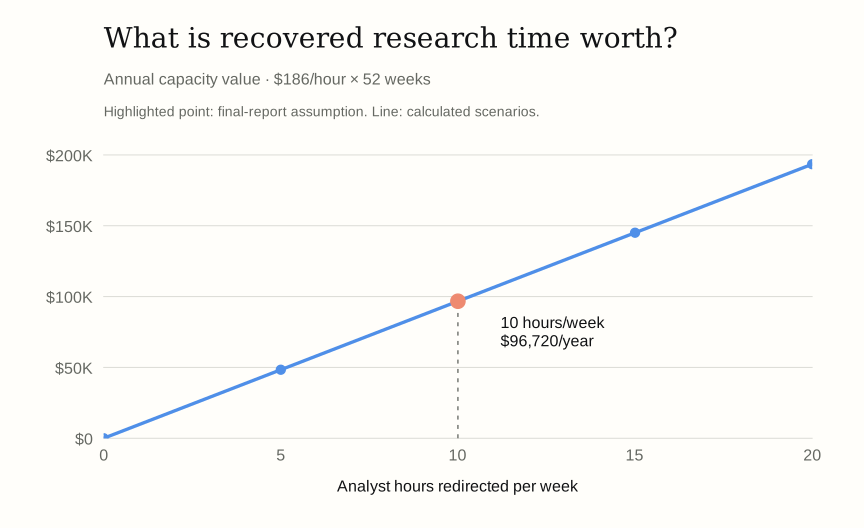
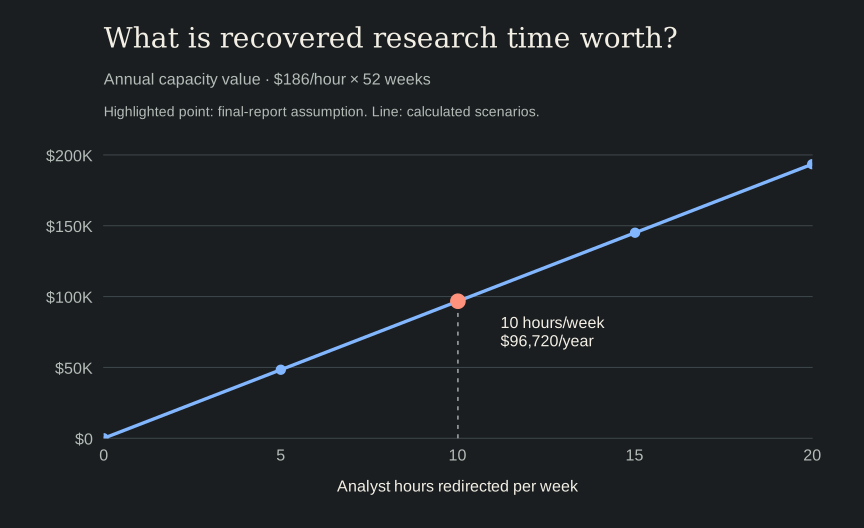
Holding the hourly cost fixed, the estimate depends directly on how much time is actually recovered. At five hours per week, the same calculation yields $48,360 annually; at fifteen hours, $145,080. Each additional hour redirected per week corresponds to $9,672 per year under these assumptions. The calculation values time available for other research; it does not imply a reduction in payroll or prove that the client realized those savings.
The report also described approximately two hours for a multi-country analytical run and a three-week-to-one-day research turnaround.4 Those statements describe different scopes, so they should not be combined into a single speedup ratio. Runtime addresses processing; turnaround includes the broader research cycle. A practical follow-up would measure collection, exception handling, analyst review, and publication separately across repeated refreshes.
The business implication is concrete: automation creates value when the recovered time improves thesis development and review. The cost model makes that proposition testable without treating a presentation estimate as a measured investment outcome.
Validation and interpretation
The final report characterized the results as pilot-scale and directionally assessed. The engineering work included checks on data coverage, score consistency, evidence provenance, and sensitivity to modeling assumptions. Inter-rater reliability testing addressed consistency in subjective assessments.
These checks answer different questions. Complete coverage does not guarantee strong evidence, and agreement between assessments does not establish predictive accuracy. Similarly, exposure to automation should not be interpreted as a causal estimate of realized job losses.
The central research lesson was that a framework needs to make uncertainty visible. A country comparison becomes more useful when an analyst can understand its drivers, trace the evidence, and identify what would change the conclusion.
Public project notes
This case study includes selected qualitative results and business-case assumptions from the June 2026 final review, redrawn for the website. Proprietary scoring rules, composite scores, trading recommendations, and the full codebase remain omitted. The short code excerpt is limited to a generic coverage check. Presentation findings, calculated scenarios, and interpretation are identified separately.
Tools and methods: Python, PostgreSQL, structured data collection, AI-assisted research, comparative analysis, sensitivity analysis, and inter-rater reliability assessment.
Footnotes
Chessboard Sovereign Index — Capstone Final Review, June 2026, slide 9, “Results & Validation.” The slide describes a pilot-scale, qualitative assessment. Its categories are reproduced here; the accompanying analysis interprets them. The illustrative dashboard values on slide 8 are not treated as measured results.↩︎
Compute Infrastructure workstream,
cii/cii_verify.py,check_scores_populated. Three lines from the country-coverage check; database query and infrastructure configuration omitted. The excerpt is shown for explanation and is not executed by this page.↩︎Chessboard Sovereign Index — Capstone Final Review, June 2026, slide 10, “Business Impact.” Cost and timing figures are reported presentation assumptions and claims. The sensitivity scenarios and 52-week annualization shown here are calculations for this case study.↩︎
Chessboard Sovereign Index — Capstone Final Review, June 2026, slide 10, “Business Impact.” Cost and timing figures are reported presentation assumptions and claims. The sensitivity scenarios and 52-week annualization shown here are calculations for this case study.↩︎