What must a growth story earn?
Qualcomm DCF Valuation · A 2023 study by Kelun Wang & team
A semiconductor company’s growth story is easy to describe: better processors, new devices, and more applications for its intellectual property. Valuation asks a harder question: how much cash can that growth produce after paying for the investment it requires?
In November 2023, our four-person team studied Qualcomm for a corporate valuation project at Peking University’s Guanghua School of Management. We used a two-stage free-cash-flow-to-the-firm model, connecting operating adjustments, reinvestment, growth, and the cost of capital. This article revisits the submitted report, including the assumptions that need more scrutiny.1
The report’s stated outcome was $151.52 per share. That is a historical model output, not a current price target. The more useful portfolio story is the path to that number—and how to distinguish a calculation that reconciles from assumptions that are economically justified.
Choose the cash flow that matches the question
We chose FCFF to value operating assets before allocating value between debt and equity holders. That gives the analysis a view of the whole business rather than tying it directly to a particular year’s dividend or financing decision.
FCFF does not make financing irrelevant: capital structure still affects the discount rate, and debt must be handled correctly when moving from operating value to equity value. The basic relationship is:
\[ \mathrm{FCFF} = \mathrm{Adjusted\ EBIT}(1-t) - \mathrm{Net\ reinvestment}. \]
The operating thesis in the report linked handset demand, on-device AI, and automotive applications to future growth. The model then had to translate that narrative into a return on capital and a reinvestment requirement. A promising product category alone does not determine either one.
Treat research as investment, then follow both sides
Research spending can support products over several years. Our model therefore capitalized R&D over an assumed seven-year life rather than treating all current research expense as the cost of one year’s sales. It also made an operating-lease adjustment.
The important accounting discipline is symmetry: if research is added back to operating income, its investment cost and amortization also need to appear consistently in the capital and cash-flow calculations. Adding back the expense without recognizing reinvestment would inflate the value.
The report’s 2023 cash-flow bridge can be reconstructed as follows. All amounts below are USD billions, converted from the report’s units of ten thousand dollars.2
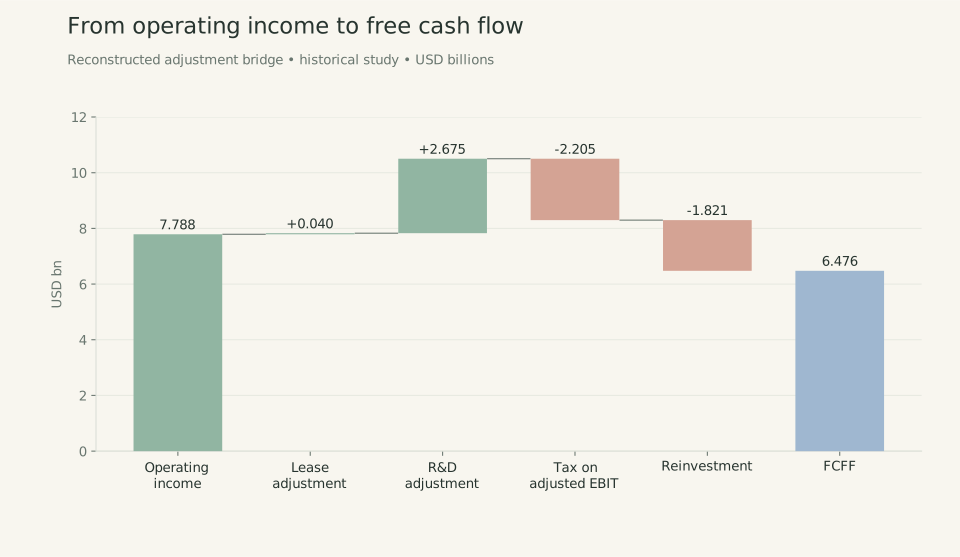
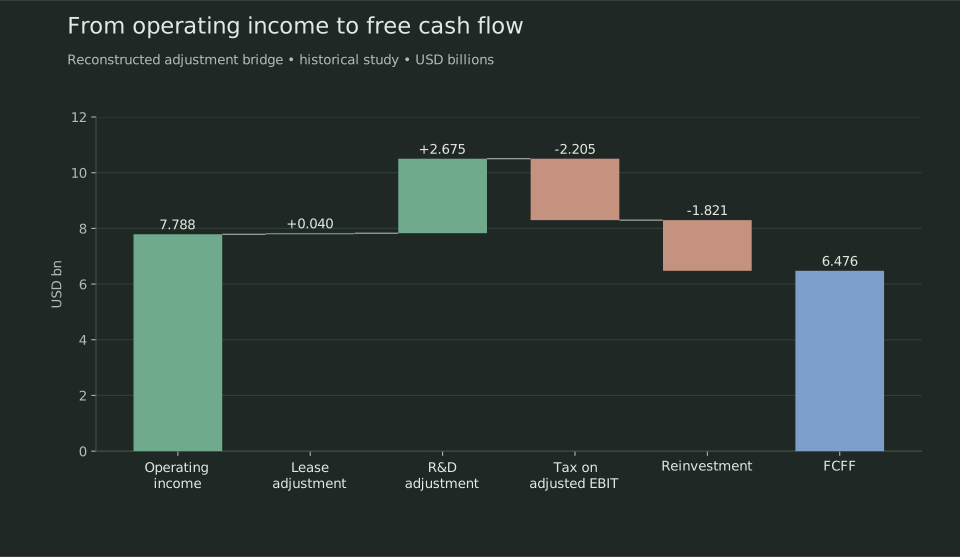
Adjusted operating income is approximately $10.502B. Applying the study’s 21% tax assumption gives $8.297B after tax; subtracting $1.821B of reinvestment leaves $6.476B of FCFF. The original prose mixes adjusted and unadjusted EBIT in one line, so this reconstruction follows the amounts that reconcile.
The following Python excerpt was written for this website to make the calculation inspectable. The submitted project was a valuation report; this is not presented as its original source code.
# USD billions; assumptions and adjustments from the 2023 report.
adjusted_ebit = 7.788 + 0.0397594 + 2.6745714
nopat = adjusted_ebit * (1 - 0.21)
fcff = nopat - 1.8205714  # approximately 6.47627
The difference between accounting earnings and distributable cash is the business point. A company can generate more adjusted operating income while committing a substantial portion of it to future products and working capital.
Make the transition to maturity explicit
The report’s numerical forecast uses 2024–2028 as five explicit forecast years after the 2023 base, with stable growth beginning in 2029. This follows the actual tables; an earlier narrative paragraph describes the timing differently.
| Model input | Explicit forecast | Stable phase |
|---|---|---|
| Growth assumption | 15.02% | 5.33% |
| Reported WACC | 6.44% | 8.65% |
| Reinvestment rate | 21.94% | 61.63% |
| Return on capital assumption | Transitions toward 20% | Set equal to WACC |
These are inputs to the historical study, not verified future outcomes. The higher stable-phase reinvestment rate is especially important. If growth continues while returns on new capital fall, more of each dollar of operating profit must be reinvested to sustain that growth.
See where the valuation comes from
The detailed table assigns approximately $41.106B to the five explicit cash flows and $148.898B to the present value of the terminal component. Together they produce $190.005B of operating value. This resolves a labeling inconsistency in the surrounding prose, which calls the terminal component the operating-asset total.3
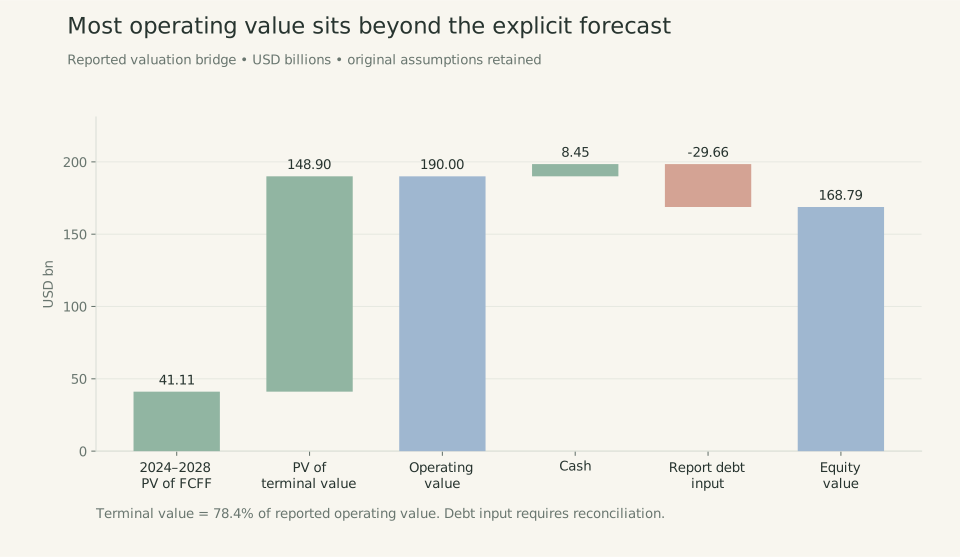
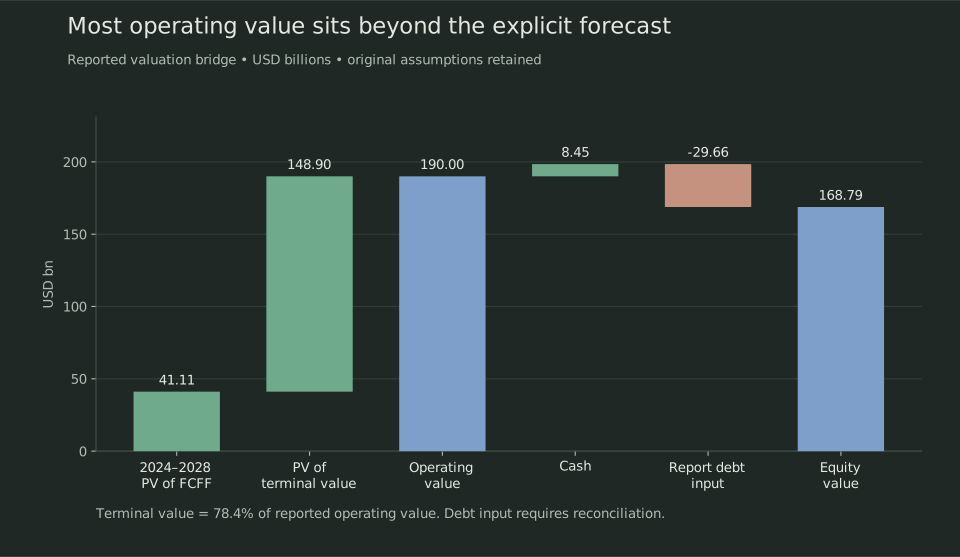
About 78.4% of reported operating value comes from the terminal component. That concentration shifts the analytical attention: long-run returns, reinvestment, and the discount rate deserve at least as much scrutiny as the first few forecast years.
The original bridge adds $8.450B of cash and subtracts its $29.663B debt input to reach $168.792B of equity value. Dividing by 1.114 billion shares reproduces the stated result. Reproducing that arithmetic is different from validating the debt input or capital weights.
Growth needs a return on the capital behind it
A useful extension is to write the stable-phase model so growth and reinvestment remain connected:
\[ \mathrm{Terminal\ value} = \frac{\mathrm{NOPAT}_{n+1}\left(1-g/\mathrm{ROC}\right)}{\mathrm{WACC}-g}. \]
Here, \(g/\mathrm{ROC}\) is the reinvestment rate required to sustain growth. The figure below varies growth and the return on new capital while holding next-year NOPAT fixed. It is a new sensitivity illustration, not an additional result from the submitted report.
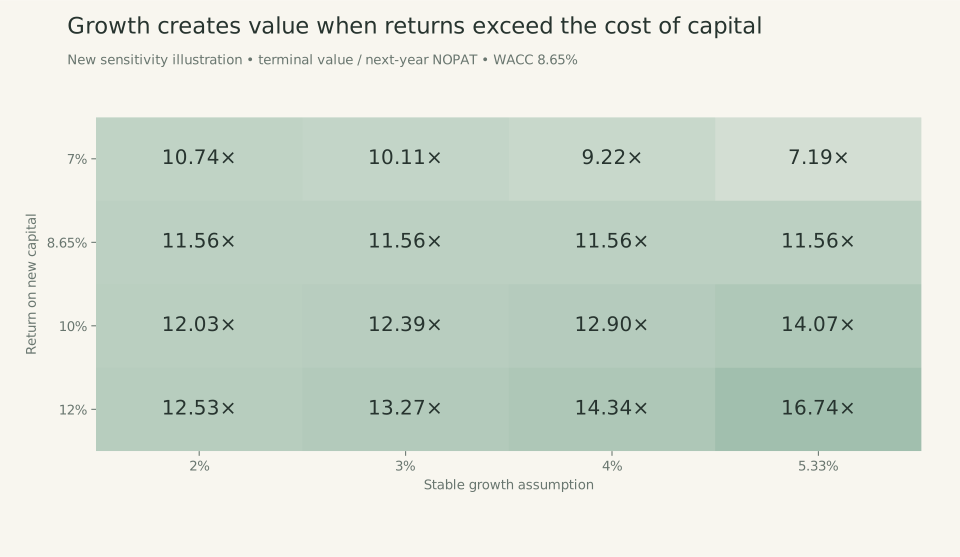
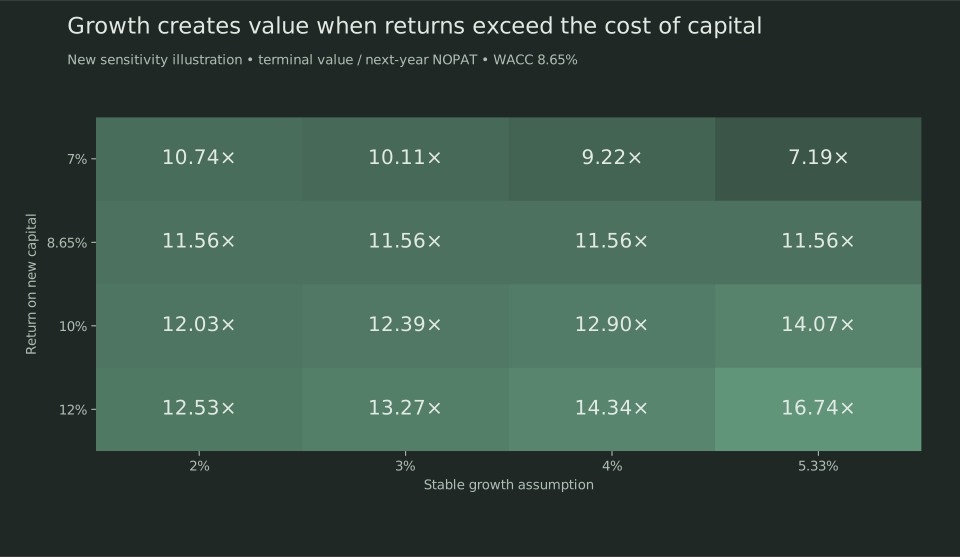
At ROC = WACC = 8.65%, the expression simplifies to \(\mathrm{NOPAT}_{n+1}/\mathrm{WACC}\), or about 11.56 times next-year NOPAT. In this controlled comparison, higher growth does not increase the multiple because it requires proportionately more reinvestment. When ROC exceeds WACC, growth increases value; when ROC falls below WACC, expansion can destroy value.
That is the central commercial question I take from the model: what evidence supports an enduring return above the cost of capital? The answer must come from pricing power, technology, customer demand, and competitive durability—not just a faster growth assumption.
What I would tighten before using it for a decision
Revisiting the report identifies a material balance-sheet issue. Its capital-weight table labels $51.040B as 2023 equity and $29.459B as debt. Qualcomm’s filed statements identify those amounts as total assets and total liabilities; reported stockholders’ equity was $21.581B. A refreshed model needs a reconciled financial-debt definition and appropriate capital weights before relying on its WACC or equity value. Qualcomm FY2023 Form 10-K.
I would also re-estimate beta with aligned return intervals, match discount-rate assumptions to the cash-flow horizon, and test the research-asset life and sustainable growth rate. The original model provides a useful structure; these checks determine whether its result is ready to support an investment decision.
This project shows how I connect a business narrative to financial mechanics: normalize the operating economics, make reinvestment visible, reconcile the valuation bridge, and identify the assumptions that carry the conclusion.
Sources and scope
This is a retrospective account of a November 2023 academic team project, included in my business-project collection for its investment-research focus. It was not a commission from Qualcomm. The website figures are redrawn calculations and labeled scenarios; the underlying workbook was not supplied, so this is not a full model audit or a refreshed investment recommendation.
Footnotes
DCF Valuation: Qualcomm, Peking University Guanghua School of Management, 16 November 2023. Team report by Kelun Wang, Junxi Han, Wenpeng Kong, and Penghao Li; project identity and date on pages 1–2.↩︎
Original report, pages 6–8. Research and lease adjustments, tax assumption, working capital, and base-year FCFF. The after-tax calculation follows adjusted EBIT rather than the unadjusted amount printed in one sentence.↩︎
Original report, pages 9–11. Forecast chronology and reported inputs follow the numerical tables. The terminal-value share is calculated from those tables. Figure 3 is an explanatory extension holding next-year NOPAT fixed.↩︎